how to use dashboards for project analytics
In today’s fast-paced project management landscape, your ability to make effective decisions hinges on accessing real-time insights.
Project analytics dashboards are indispensable tools that offer you a visual snapshot of key metrics, driving efficiency, communication, and collaboration.
This article delves into the myriad benefits of utilizing dashboards. You ll discover how they enhance your time management skills and facilitate effective budget analysis.
We will show you how to set up and customize these dashboards to align perfectly with your specific projects, complemented by tips for maximizing their impact.
Get ready to revolutionize how you manage projects!
Contents
- Key Takeaways:
- Benefits of Using Dashboards for Project Analytics
- Key Metrics to Track on Project Analytics Dashboards
- How to Set Up and Customize Project Analytics Dashboards
- Tips for Effective Use of Project Analytics Dashboards
- Frequently Asked Questions
- How can dashboards be used for project analytics?
- What types of data can be analyzed using project dashboards?
- Can project dashboards be customized to fit my specific project needs?
- Are project dashboards easy to use?
- How can project dashboards improve project management?
- Can project dashboards be accessed by multiple team members?
Key Takeaways:
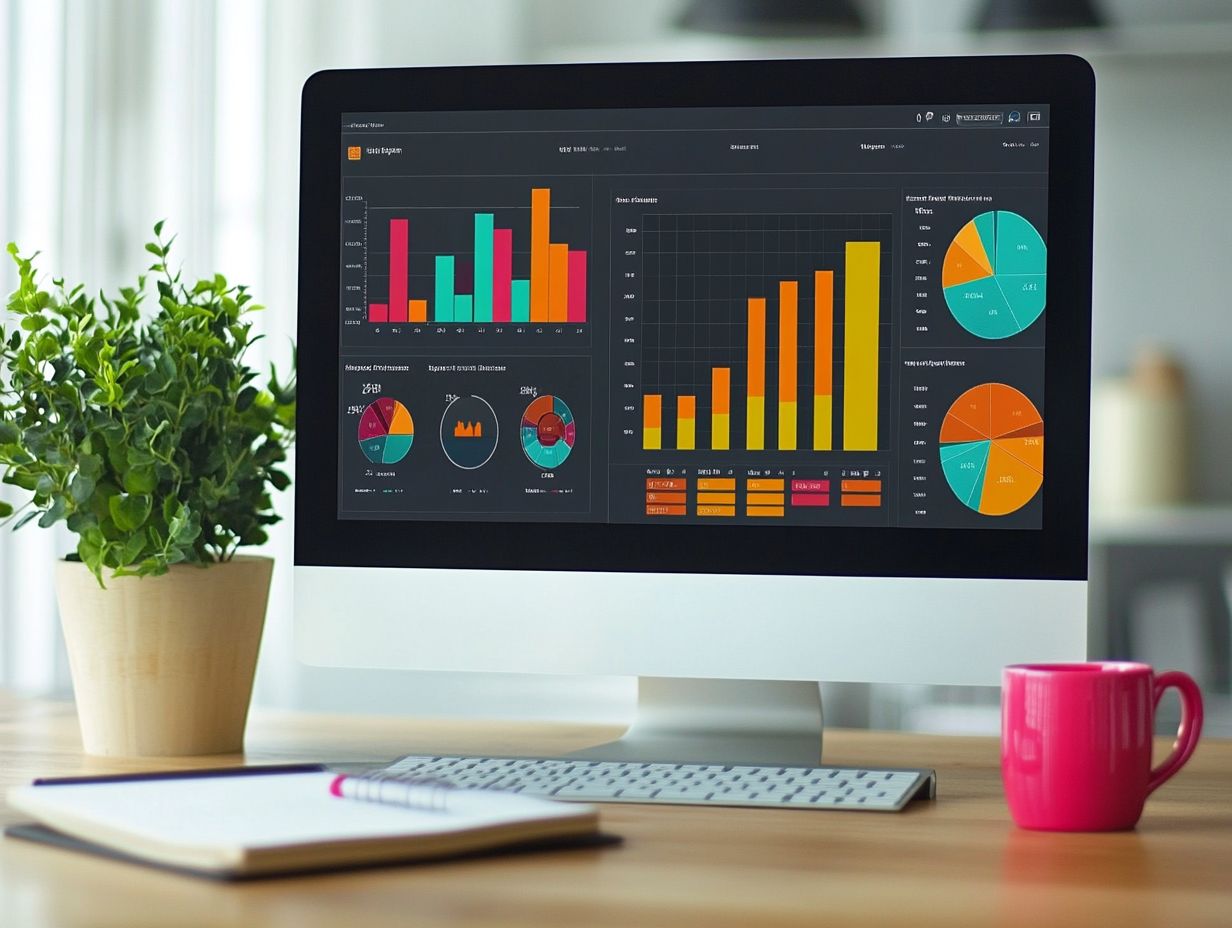
- Dashboards for project analytics can improve efficiency, decision-making, communication, and collaboration.
- Key metrics to track include time management, resource allocation, budget, and cost analysis.
- To effectively use project analytics dashboards, regularly monitor and update them, and interpret and utilize the data for decision-making.
What are Project Analytics Dashboards?
Project analytics dashboards serve as powerful instruments that consolidate project metrics. They offer you an at-a-glance perspective on various aspects of project performance, including progress, timelines, and important measurements that show how well the project is doing. Utilizing analytics for enhanced project communication can further improve your understanding and management of these metrics.
Data visualization tools help you monitor project health effectively. This facilitates informed decision-making and timely feedback for stakeholders.
In today s rapid-paced business landscape, utilizing a project management dashboard is essential for optimizing project tasks and ensuring alignment with your organizational objectives.
These dashboards integrate seamlessly with platforms like Google Analytics, Microsoft Excel, and Trello. This enables you to pull real-time data from diverse sources into a cohesive view.
Each component can be tailored to reflect the specific metrics that matter most to your project, whether it’s budget tracking, resource allocation, or timeline adherence.
This customization enhances the functionality of the dashboards, allowing them to adapt to varying project needs and improving coordination among team members.
As a result, stakeholders can easily interpret complex data and uncover insights that drive strategic adjustments, ultimately leading to enhanced performance outcomes.
Benefits of Using Dashboards for Project Analytics
The advantages of leveraging dashboards for project analytics are numerous and profound. They elevate project health, stakeholder engagement, and the overall efficiency of project planning.
When you employ a project management dashboard, you unlock real-time insights that enhance team communication and streamline decision-making processes.
This proactive approach improves how you track project metrics and tasks, fostering a more efficient workflow and boosting customer satisfaction.
Efficiency and Decision-Making
Utilizing a project analytics dashboard significantly elevates your efficiency and enhances your decision-making capabilities as a project manager or team member.
By presenting real-time project metrics and key performance indicators (KPIs), you gain swift insight into project health. This enables you to make informed choices about resource allocation and cash management.
This direct access to project analysis encourages a proactive approach to your tasks, minimizing delays and inefficiencies.
The power of data visualization tools is something you ll find invaluable. They transform complex data sets into intuitive charts and graphs, allowing you to spot trends and anomalies at a glance.
With these dashboards, tracking progress against milestones becomes effortless. This enables you to make immediate adjustments when necessary and mitigate potential risks.
Visualizing project data in a clear and concise manner enhances communication among team members and stakeholders. It also ensures everyone remains aligned with the project’s goals and timelines.
Ultimately, integrating these tools streamlines your workflows and fosters a culture of data-driven decision-making.
Improved Communication and Collaboration
Improved communication and collaboration stand out as some of the most significant advantages of integrating project analytics dashboards into your project management framework. By centralizing project tasks and providing clear visibility into metrics, you can enhance coordination and gather invaluable feedback from stakeholders. This approach fosters a collaborative environment where insights from market research and project health are instantly accessible to every team member.
These dashboards often feature real-time updates, allowing you to track progress as it unfolds, which facilitates swifter decision-making. Feedback loops are seamlessly integrated, giving everyone the power to comment, suggest changes, or raise concerns without missing a beat.
Tools like Slack and Microsoft Project can easily connect to these dashboards, enriching your communication further. With instant messaging and task management capabilities, these software solutions work in tandem to keep everyone informed and engaged, promoting not just transparency but also an agile response to the ever-evolving project landscape.
Key Metrics to Track on Project Analytics Dashboards
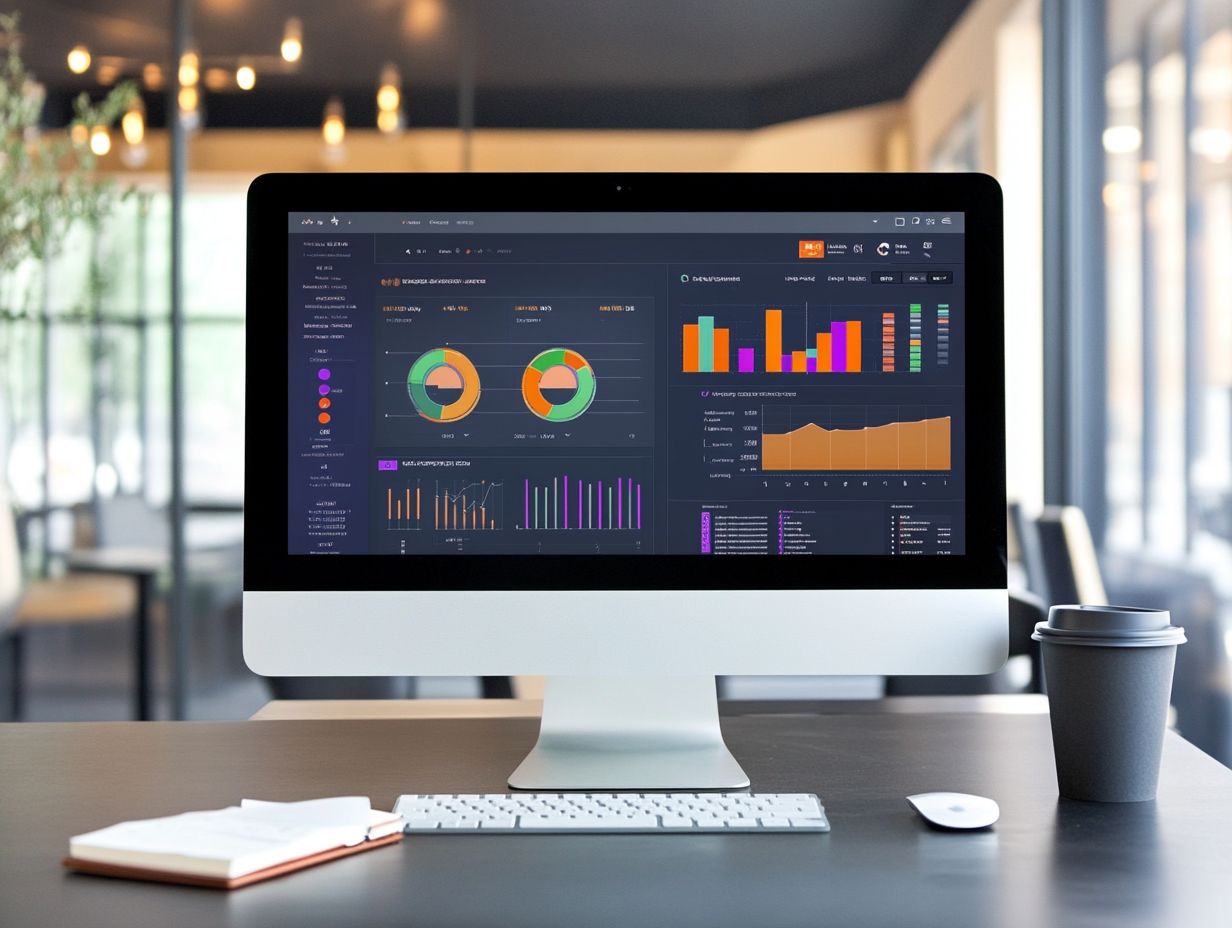
Tracking key metrics on your project analytics dashboards is vital for preserving project health and ensuring customer satisfaction throughout the project lifecycle.
Key performance indicators (KPIs) include:
- Project timelines
- Budget adherence
- Stakeholder engagement
These indicators are critical for evaluating project data. This insight gives you the power to keep your team on track while simultaneously enhancing the overall outcomes of your project planning and execution.
Time Management and Resource Allocation
Mastering time management and resource allocation is key to project success! Effective analytics dashboards serve as invaluable tools for monitoring these critical aspects. By visualizing project timelines and analyzing resource allocation, you can ensure that tasks are completed on schedule and within budget.
This important monitoring helps maintain effective cash management practices and enhances your overall project analysis.
These frameworks foster flexibility and continuous improvement, enabling your team to adapt swiftly to changing requirements and unforeseen challenges. Agile methodologies are a flexible approach that allows teams to adapt quickly to changes and encourage iterative progress through regular feedback loops.
DevOps combines development and operations, creating a collaborative environment that streamlines the deployment process.
Tools like Jira and Trello are popular choices that can help you track progress, manage workloads, and allocate resources more effectively. Utilizing such tools not only enhances transparency but also gives your team the power to make informed decisions, ultimately leading to more successful project outcomes.
Budget and Cost Analysis
Budgeting and cost analysis are essential for maintaining project health and ensuring financial viability throughout its duration. By utilizing analytics dashboards, you can effectively visualize project data and revenue metrics, enabling real-time budget analysis and ensuring that your expenses align with project goals.
This level of transparency not only fosters accountability but also supports strategic decision-making in cash management.
Leveraging tools like Microsoft Excel and Harvest can significantly enhance your ability to track budget performance and gain insights into cost implications. Excel s powerful functionalities, such as pivot tables and charts, allow for thorough data manipulation, while Harvest provides user-friendly time tracking and expense reporting features.
For instance, you can set up dashboards to compare actual spending against budgeted figures, facilitating the identification of variances. You might also simulate various budget scenarios, which helps refine your financial forecasts and improve overall budget management.
By regularly reviewing these dashboards, you can make informed adjustments that keep your projects on track financially.
How to Set Up and Customize Project Analytics Dashboards
Setting up and customizing project analytics dashboards is important for aligning your project management with your organization’s objectives, particularly when using analytics to drive project decisions.
By selecting the right dashboard components and using tools like Microsoft Project, Smartsheet, or Tableau, you can create dashboards that meet your specific needs.
A tailored dashboard enhances visibility into project tasks and metrics and ensures effective monitoring of project health and stakeholder engagement.
This strategic approach helps you stay on top of your projects and drive success.
Choosing the Right Tools and Software
Choosing the right tools and software for your project analytics dashboards is crucial for effective data visualization and project management. Options like Microsoft Project, Trello, and Basecamp offer distinct functionalities that elevate how you visualize project metrics and tasks.
Select data visualization tools that meet your team’s needs for project success and enhance stakeholder satisfaction.
When evaluating these software solutions, consider essential criteria like user-friendliness, customization options, integration capabilities, and available support.
For instance, Microsoft Project provides robust scheduling features ideal for complex projects. In contrast, Trello excels in its simplicity and visual task management, making it suitable for smaller teams or straightforward workflows.
Basecamp fosters collaboration through its communication tools and centralized task management. Understanding these differences gives you the power to choose tools that suit your project management style and boost productivity.
Customizing Dashboards for Specific Projects
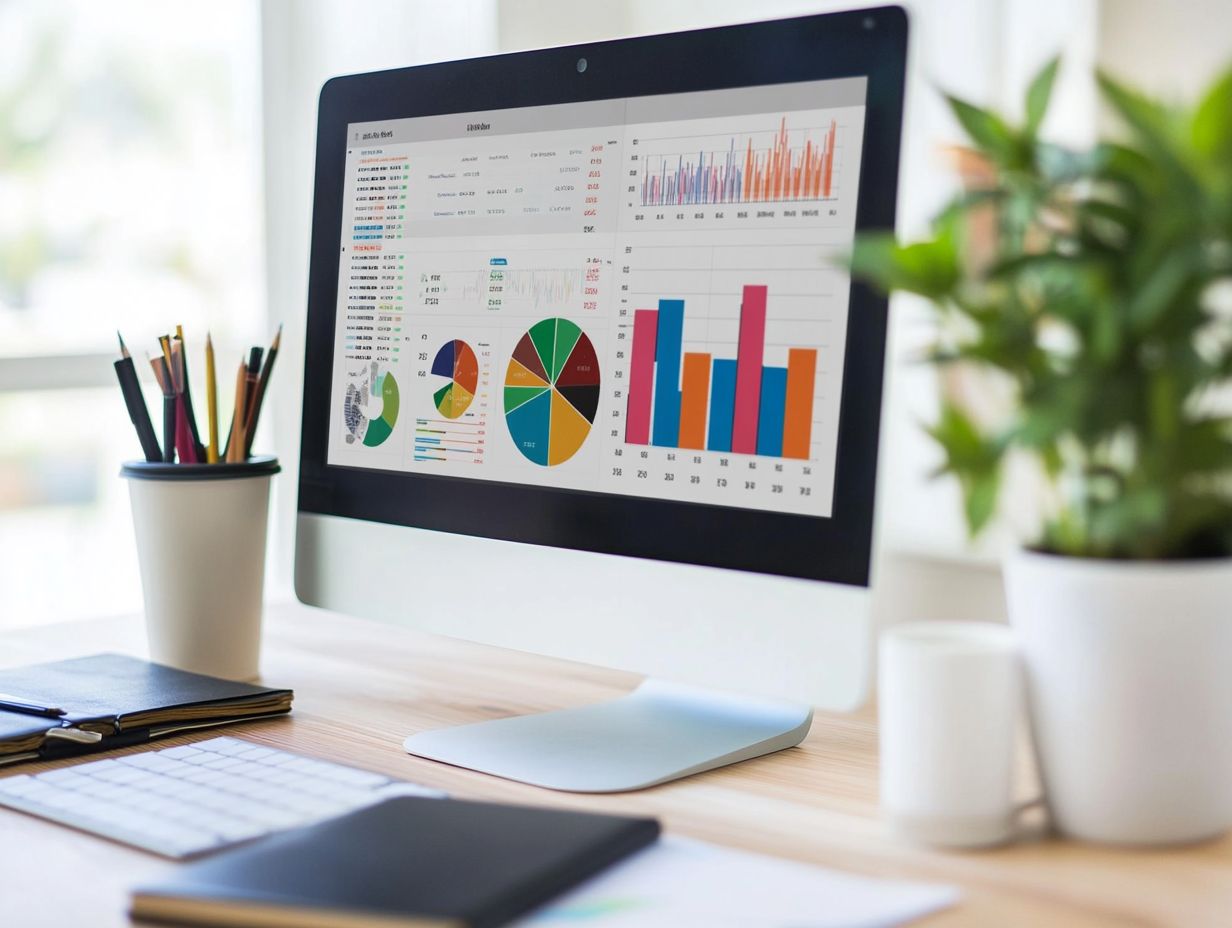
Customizing your dashboards for specific projects significantly enhances their relevance and effectiveness. By prominently displaying critical project metrics, you create a clear focus on what truly matters.
Tailoring dashboard components to reflect your project analysis needs facilitates seamless team communication and enables effective tracking of progress and task management.
The customization process starts with selecting relevant metrics, such as task completion rates, budget utilization, and team performance indicators. Once you’ve identified these key metrics, you can configure the dashboard layouts to highlight the most pertinent information, allowing for quick visual assessments.
For example, in software development, integrating metrics like sprint velocity (the amount of work completed in a sprint) and issue resolution time helps your team monitor workflow and make informed decisions. Similarly, in marketing campaigns, tracking conversion rates and audience engagement through tailored dashboards allows you to make real-time adjustments to your strategies, driving optimal outcomes.
Tips for Effective Use of Project Analytics Dashboards
Unlock the full potential of your project analytics dashboards by engaging in regular monitoring and skillfully interpreting the data.
By consistently reviewing project health indicators and actively seeking stakeholder feedback, you can ensure that the dashboard remains a powerful tool for boosting customer satisfaction and meeting project objectives.
This proactive approach helps you identify challenges early and adjust your strategies as needed.
Regular Monitoring and Updating
Regularly monitoring and updating your project analytics dashboards is essential for ensuring the health of your projects. Diligently tracking project measurements and incorporating stakeholder feedback maintains an accurate and relevant view of your project s progress.
This ongoing oversight keeps everyone informed and accountable. It allows for timely adjustments to your tasks and strategies.
To maximize the benefits of your dashboards, establish a regular update schedule to keep your data fresh and reliable. Daily or weekly reviews might be ideal for fast-paced initiatives, while bi-weekly or monthly assessments could suffice for longer-term projects.
Engaging your team in this process enhances their understanding of the data and encourages a sense of collective ownership over project outcomes.
Maintaining precise data is crucial for effective stakeholder engagement, as it builds trust and enables knowledge-based decision-making. These best practices create a solid framework that supports successful project execution and alignment with your overarching goals.
Interpreting and Utilizing Data
Interpreting and utilizing data from project analytics dashboards is vital for driving informed analysis and ensuring customer satisfaction. By grasping the implications of project measurements, you can make data-driven decisions regarding project tasks and resource allocation.
This proactive approach gives you the power to implement timely interventions that enhance project outcomes and align perfectly with stakeholder expectations. Identifying emerging trends and anomalies within your data sets is essential for effective navigation.
By recognizing patterns over time, you can forecast future behaviors and potential challenges. This analysis provides valuable insights for strategic planning, enabling you to prioritize tasks that significantly contribute to project health.
This deeper understanding cultivates a culture of continuous improvement, where lessons learned from past experiences are seamlessly integrated into future projects. This results in more efficient processes and higher-quality deliverables.
Frequently Asked Questions
How can dashboards be used for project analytics?
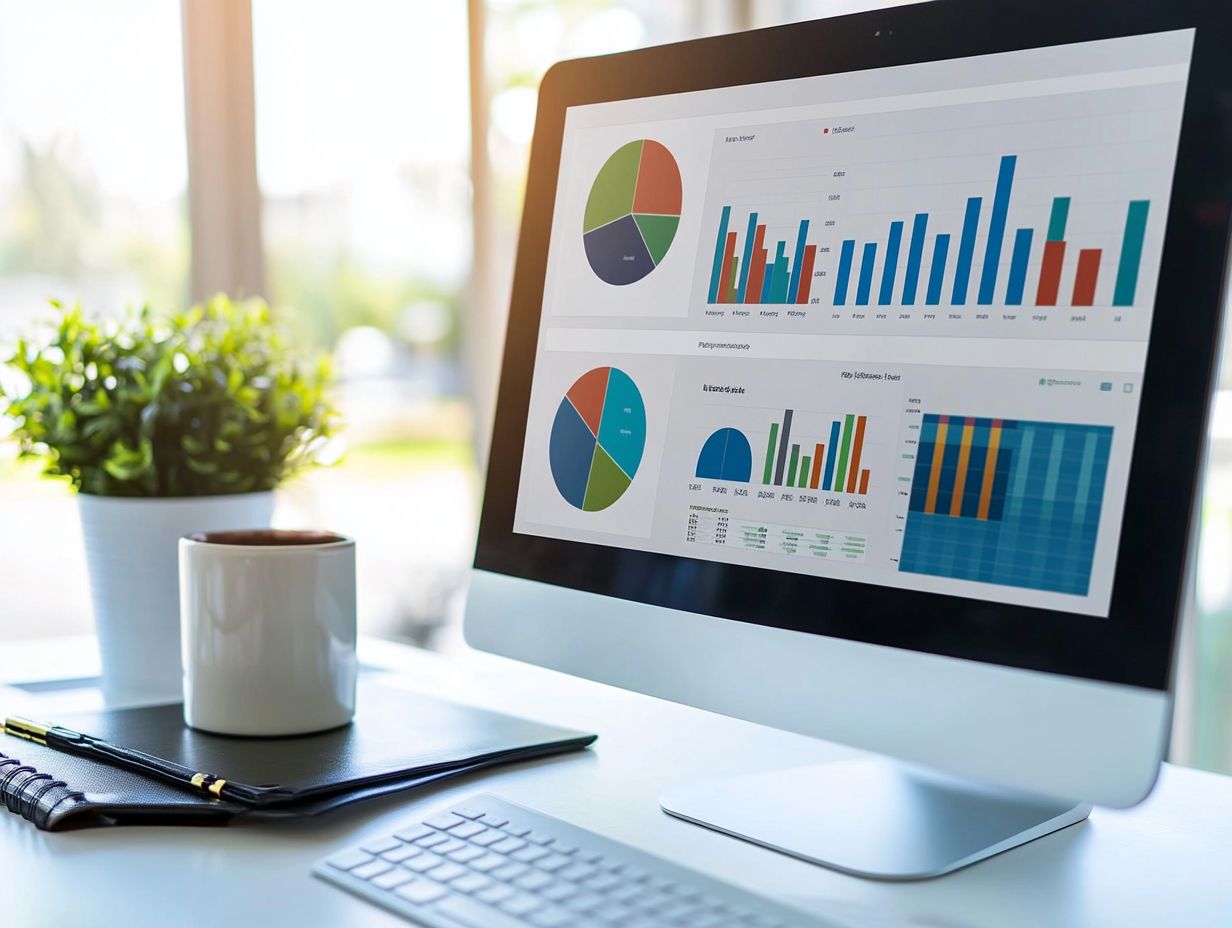
Dashboards provide a visual representation of data and measurements related to your project. They allow you to track progress, identify trends, and make informed decisions.
What types of data can be analyzed using project dashboards?
Project dashboards can analyze various data, including project timelines, budgets, team performance, task completion rates, and any other custom measurements that are important to your project.
Can project dashboards be customized to fit my specific project needs?
Yes, project dashboards are customizable. You can select which measurements and data to display, as well as the layout and design of the dashboard.
Are project dashboards easy to use?
Yes, project dashboards are designed to be user-friendly and intuitive. Most dashboards offer drag-and-drop features, customizable widgets, and easy-to-understand charts and graphs.
How can project dashboards improve project management?
Project dashboards improve project management by providing real-time data and insights. This allows for better decision-making, identifying potential issues or delays, and promoting transparency and collaboration within the team.
Can project dashboards be accessed by multiple team members?
Yes, project dashboards can be shared with multiple team members. This allows for real-time collaboration and visibility, improving communication and keeping everyone aligned on project progress and goals.
